Hidden Data - What Websites Are Really Telling You
The most valuable data is often the hardest to see. Discover how Google Analytics and Microsoft Clarity turn invisible user actions into something you can actually understand.
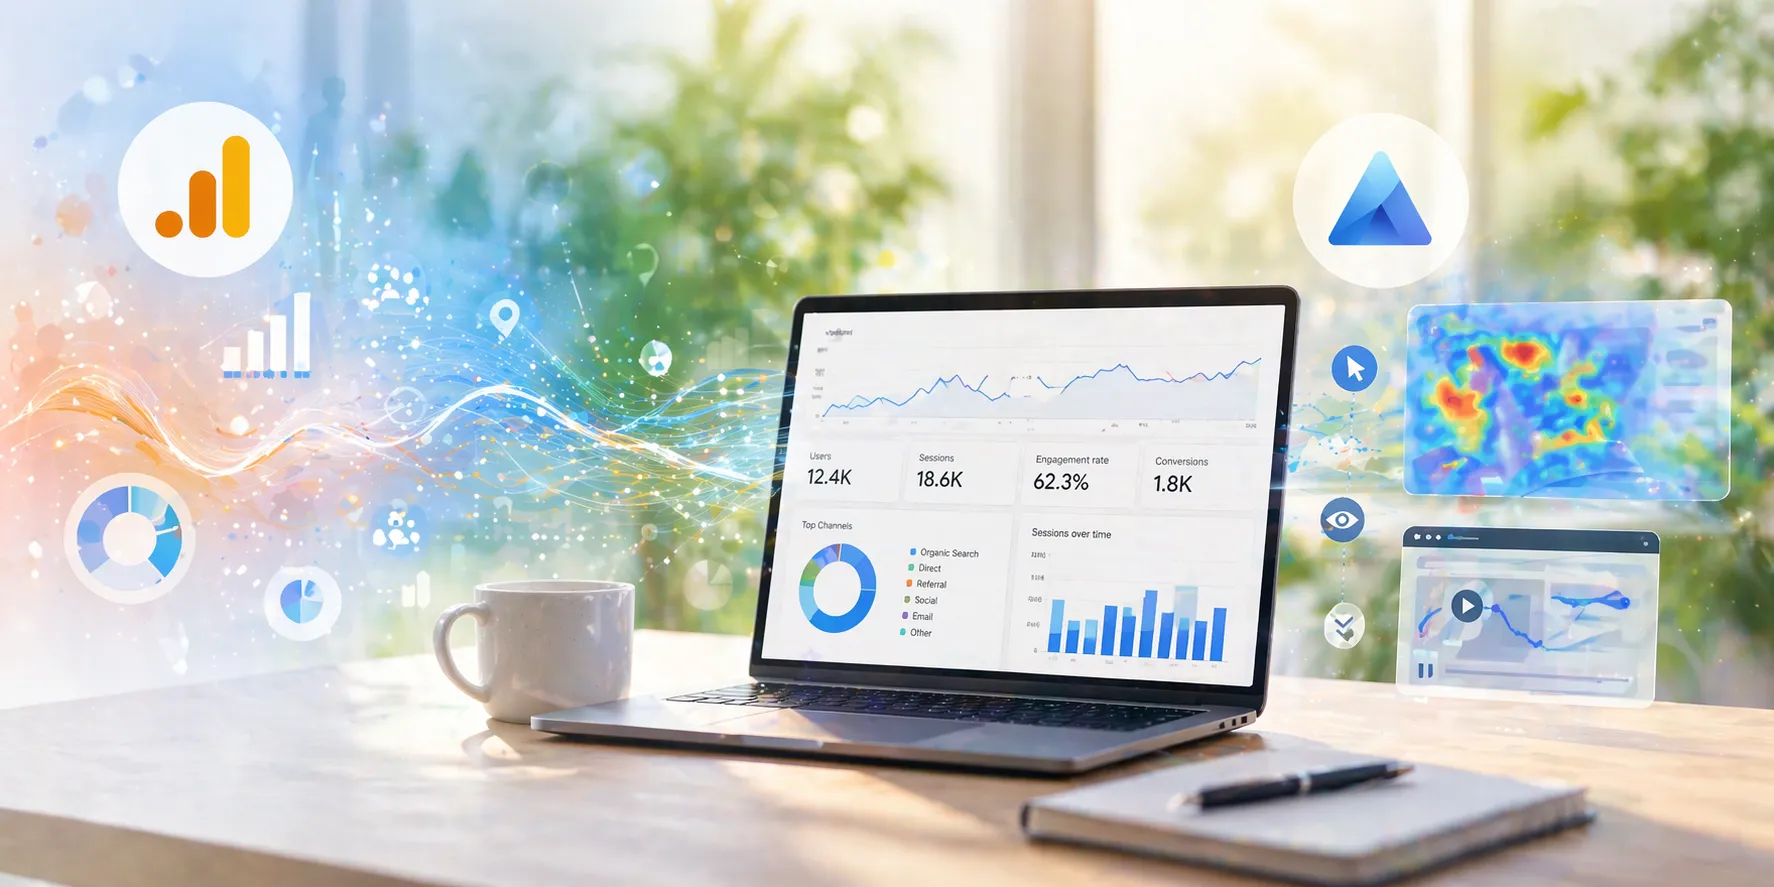
Most people think of data as something clean.
A CSV file. An Excel sheet. Rows and columns ready to analyze.
But that is not how data actually begins.
In reality, data starts messy. It is scattered across interactions, hidden inside behavior, and often invisible to the naked eye. It does not arrive structured. It does not come labeled. It exists first as raw activity, clicks, scrolls, pauses, exits, before it ever becomes something you can analyze.
For a long time, I saw data as something you extract from files.
Then I started working with websites.
And that completely changed how I think about it.
When you open a website, it feels simple. You land on a page, read a bit, maybe click something, then leave. From a user perspective, it is a straightforward experience.
But behind that simplicity, something else is happening.
Every action you take is being recorded in some form.
When you scroll, that is data. When you hover, that is data. When you stop reading, that is data. When you leave, that is data.
The problem is you do not see any of it.
It is happening silently in the background.
And unless you capture it, it disappears.
That is where I discovered two tools that made this invisible layer visible: Google Analytics and Microsoft Clarity.
They do not just collect data.
They translate behavior.
Google Analytics was my first real exposure to website data. At first, it feels like a dashboard full of numbers. Users, sessions, engagement rates, traffic sources. Everything is summarized into metrics. Clean. Structured. Easy to compare.
And that is exactly its strength.
It takes chaotic user activity and turns it into something measurable. You start to see patterns quickly. You see how many people visit your site. You see where they come from. You see which pages they spend time on. You see where they leave.
Suddenly, your website is not just a page, it is a system you can measure.
Globally, more than 55 to 60% of websites use Google Analytics. That alone shows how important structured tracking has become in understanding online behavior.
But as useful as it is, something felt incomplete.
Because while it shows you what is happening, it does not always explain why it is happening.
That is where Microsoft Clarity comes in.
If Google Analytics is about numbers, Clarity is about behavior.
Instead of just metrics, you see interaction. You see heatmaps that show where users actually click. You see scroll tracking that reveals how far people go. You can even watch session recordings, real users navigating your site step by step.

That changes everything.
Because now, you are not just reading reports.
You are observing behavior.
There was a moment where this difference became very clear to me. You might see in Google Analytics that a page has a high drop-off rate. Users are leaving quickly. On paper, that is just a number.
But when you look at the same page in Clarity, you might see something different. Users scroll halfway. They pause. They move their cursor around. Then they leave.
That pause, that hesitation, is data.
But it is not something you can easily capture in a single metric.
It is context.
And context is what turns data into insight.
That is when everything clicked for me.
Data does not only exist in files.
It exists in behavior.
The way users move through a page, the elements they ignore, the sections they focus on, these are all signals. They just do not look like traditional data yet.
Google Analytics translates behavior into structured metrics. Microsoft Clarity translates behavior into visual patterns. Together, they give you both sides of the story.
This changed how I approach analysis completely.
Before, I focused on outputs. Reports. Tables. Summaries.
Now, I focus more on what creates those outputs in the first place.
Instead of asking, “What does the data say?” I started asking, “What behavior produced this data?”
That shift is subtle, but it changes everything. Because once you understand behavior, you stop reacting to data and start improving systems.
From a practical standpoint, using both tools together is where the real value comes in. Google Analytics helps you identify problems at scale. You can quickly see trends. You can spot drops in engagement. You can compare performance across pages.
Then Microsoft Clarity helps you understand those problems. You see where users struggle. You see where they hesitate. You see where the experience breaks.
It turns assumptions into something observable.
And this is where most people miss the opportunity.
A lot of websites collect data. But very few actually understand it. They track traffic, but not behavior. They measure clicks, but not experience. They see numbers, but not patterns.
That is the gap.
Working with website analytics made me realize something important. The most valuable data is rarely the cleanest. It does not come labeled. It does not come organized. It does not sit neatly inside spreadsheets waiting to be analyzed.
It exists in motion.
It exists in how people interact with what you build.
And once you start seeing that layer, data stops being something static. It becomes something alive. Something constantly being generated, constantly changing, and constantly revealing how systems actually perform in the real world.
And when you understand that, you do not just analyze data anymore.
You start designing better experiences from it.