Insights 3 min read

Why Data Pulled Me In And Why It Matters More Than Ever

A personal breakdown of how curiosity led me into Data Analytics, and why data, not AI, is the real driver behind modern systems.
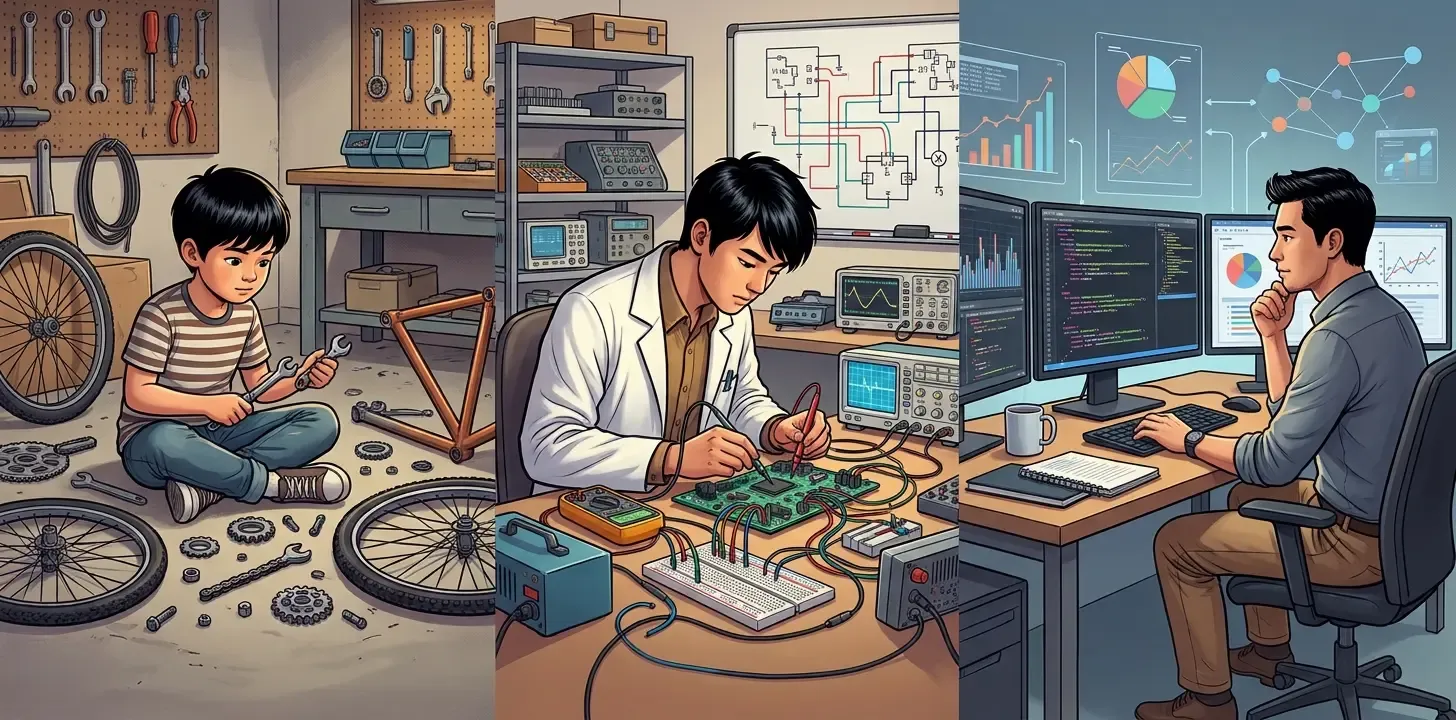
Three panels: a boy taking a bicycle apart, a young engineer testing a circuit board, and a man at a desk of data dashboards.

Most people see a cool gadget and say, “Wow, that’s so cool.”

I see it and go, “Wait, how did that even happen?”

I’ve been like that since I was little. When I was a kid, I took apart my bike because I wanted to see how it worked.

I got every piece off.

And then I had no idea how to put it back together.

I never fixed it.

But that didn’t stop me from being curious. If anything, it made me want to know more.

Math was easy for me. It follows a pattern. If you know the pattern and you understand it, you can answer anything.

Grammar was a different story.

Not so much.

Then I studied electronics in college, and I noticed something. A lot of people were happy when something just worked. Not me. I had to know why it worked and what was going on inside it.

I kept digging, and without knowing it, that habit was pointing me toward data.

It showed up in everyday life too. Take YouTube. It seems to know what I want to watch before I do. It brings back the channels I like, shows me new ones that somehow fit, and quietly drops the stuff I never click.

That isn’t luck.

It’s learning from everything I’ve watched before.

That’s when it clicked for me. What looks like magic is really information working quietly in the background.

These days everyone talks about AI. But AI is only as good as the information it learns from.

If the information is messy, the results will be messy too.

Here’s the part most people never see. When things go wrong, it’s usually not the smart system that’s broken.

It’s the information feeding it.

Bad information costs companies around $12.9 million a year in mistakes and wrong decisions.

And in the real world, information is never neat. Pieces are missing. Names are spelled five different ways. The same thing is saved in three different places.

Build anything on top of that and the mess carries right through.

That’s the work I love. Cleaning things up and making them ready to use.

I used to fix the same files by hand over and over, and it got old fast. So I started building little helpers that do the cleaning for me, so it only has to be done once.

When the base is solid, everything after it gets faster and easier.

And there’s so much of it out there. The world has already made over 120 zettabytes of data, which is more than I can even picture, and it keeps growing every year.

Every click, search, and purchase adds a little more.

But having a lot of it doesn’t mean much if nobody can use it. Piles of unused data are just noise.

Looking back, I don’t remember one big moment where I chose this field. It just felt like the road I was always on.

The kid who took apart his bike wanted to know how things work, and that kid grew up to work with data.

I get to take something messy and make it clear.

I get to take something slow and make it quick.

And I get to help people make decisions without guessing.

That’s why I love it.

Data is everywhere, and most of it is still waiting for someone to put it to good use.

The world's data, 1968 to 2030 Estimates, log scale: each line is 10 times the one below.
  1. 1968–90 · ≈×97 Early computing ARPANET 1969 · Modern hard drive 1973 · IBM PC 1981
  2. 1991–2003 · ×15 The web World Wide Web 1991 · Google 1998 · Digital passes analog 2002
  3. 2004–09 · ×14 Social and smartphones Facebook 2004 · YouTube 2005 · AWS cloud 2006 · iPhone 2007
  4. 2010–19 · ×32 Mobile internet and cloud 4G networks 2010 · Instagram 2010 · Deep learning 2012 · 5G 2019
  5. 2020–30 · ≈×10 The AI era COVID-19 2020 · ChatGPT & LLMs 2022

Dashed: estimate or forecast

About these numbers

Estimates, not measurements: about 47,000-fold growth from 1986 to 2023.

  • Up to 2007: the world's capacity to store information, analog and digital (Hilbert and López, Science, 2011). Years between their figures are filled in.
  • From 2010: data created, captured, copied and consumed each year (Statista, based on IDC). It counts every copy and stream, so part of the 2007 to 2010 jump is a change in what is counted.
  • Dashed: before 1986, extended back at 20% a year. After 2023, Statista's forecast to 2028, then about 26% a year.
YearWorld dataEraKind of figure
1968≈98 PBEarly computingEstimate, extended back at 20% a year
1969≈120 PBEarly computingEstimate, extended back at 20% a year
1970≈140 PBEarly computingEstimate, extended back at 20% a year
1971≈170 PBEarly computingEstimate, extended back at 20% a year
1972≈200 PBEarly computingEstimate, extended back at 20% a year
1973≈240 PBEarly computingEstimate, extended back at 20% a year
1974≈290 PBEarly computingEstimate, extended back at 20% a year
1975≈350 PBEarly computingEstimate, extended back at 20% a year
1976≈420 PBEarly computingEstimate, extended back at 20% a year
1977≈500 PBEarly computingEstimate, extended back at 20% a year
1978≈600 PBEarly computingEstimate, extended back at 20% a year
1979≈730 PBEarly computingEstimate, extended back at 20% a year
1980≈870 PBEarly computingEstimate, extended back at 20% a year
1981≈1 EBEarly computingEstimate, extended back at 20% a year
1982≈1.3 EBEarly computingEstimate, extended back at 20% a year
1983≈1.5 EBEarly computingEstimate, extended back at 20% a year
1984≈1.8 EBEarly computingEstimate, extended back at 20% a year
1985≈2.2 EBEarly computingEstimate, extended back at 20% a year
19862.6 EBEarly computingStorage capacity, Hilbert and López
1987≈3.4 EBEarly computingFilled in between published figures
1988≈4.4 EBEarly computingFilled in between published figures
1989≈5.6 EBEarly computingFilled in between published figures
1990≈7.3 EBEarly computingFilled in between published figures
1991≈9.4 EBThe webFilled in between published figures
1992≈12 EBThe webFilled in between published figures
199316 EBThe webStorage capacity, Hilbert and López
1994≈19 EBThe webFilled in between published figures
1995≈23 EBThe webFilled in between published figures
1996≈27 EBThe webFilled in between published figures
1997≈32 EBThe webFilled in between published figures
1998≈38 EBThe webFilled in between published figures
1999≈46 EBThe webFilled in between published figures
200055 EBThe webStorage capacity, Hilbert and López
2001≈69 EBThe webFilled in between published figures
2002≈88 EBThe webFilled in between published figures
2003≈112 EBThe webFilled in between published figures
2004≈143 EBSocial and smartphonesFilled in between published figures
2005≈182 EBSocial and smartphonesFilled in between published figures
2006≈232 EBSocial and smartphonesFilled in between published figures
2007295 EBSocial and smartphonesStorage capacity, Hilbert and López
2008≈558 EBSocial and smartphonesFilled in between published figures
2009≈1.1 ZBSocial and smartphonesFilled in between published figures
20102 ZBMobile internet and cloudData created, Statista (IDC)
20115 ZBMobile internet and cloudData created, Statista (IDC), read from a chart
20126.5 ZBMobile internet and cloudData created, Statista (IDC)
20139 ZBMobile internet and cloudData created, Statista (IDC), read from a chart
201413 ZBMobile internet and cloudData created, Statista (IDC), read from a chart
201516 ZBMobile internet and cloudData created, Statista (IDC)
201618 ZBMobile internet and cloudData created, Statista (IDC), read from a chart
201726 ZBMobile internet and cloudData created, Statista (IDC), read from a chart
201833 ZBMobile internet and cloudData created, Statista (IDC)
201941 ZBMobile internet and cloudData created, Statista (IDC), read from a chart
202064 ZBThe AI eraData created, Statista (IDC)
202184 ZBThe AI eraData created, Statista (IDC)
2022101 ZBThe AI eraData created, Statista (IDC)
2023123 ZBThe AI eraData created, Statista (IDC)
2024149 ZBThe AI eraForecast, Statista (IDC)
2025182 ZBThe AI eraForecast, Statista (IDC)
2026221 ZBThe AI eraForecast, Statista (IDC)
2027291 ZBThe AI eraForecast, Statista (IDC)
2028394 ZBThe AI eraForecast, Statista (IDC)
2029≈496 ZBThe AI eraForecast, extended at 26% a year
2030≈626 ZBThe AI eraForecast, extended at 26% a year