Too Many Applicants, Too Few Jobs, and How to Win
What the numbers say about getting hired. A data story about the line every new graduate stands in: how long it is, why it barely moves, and how to get to the front.
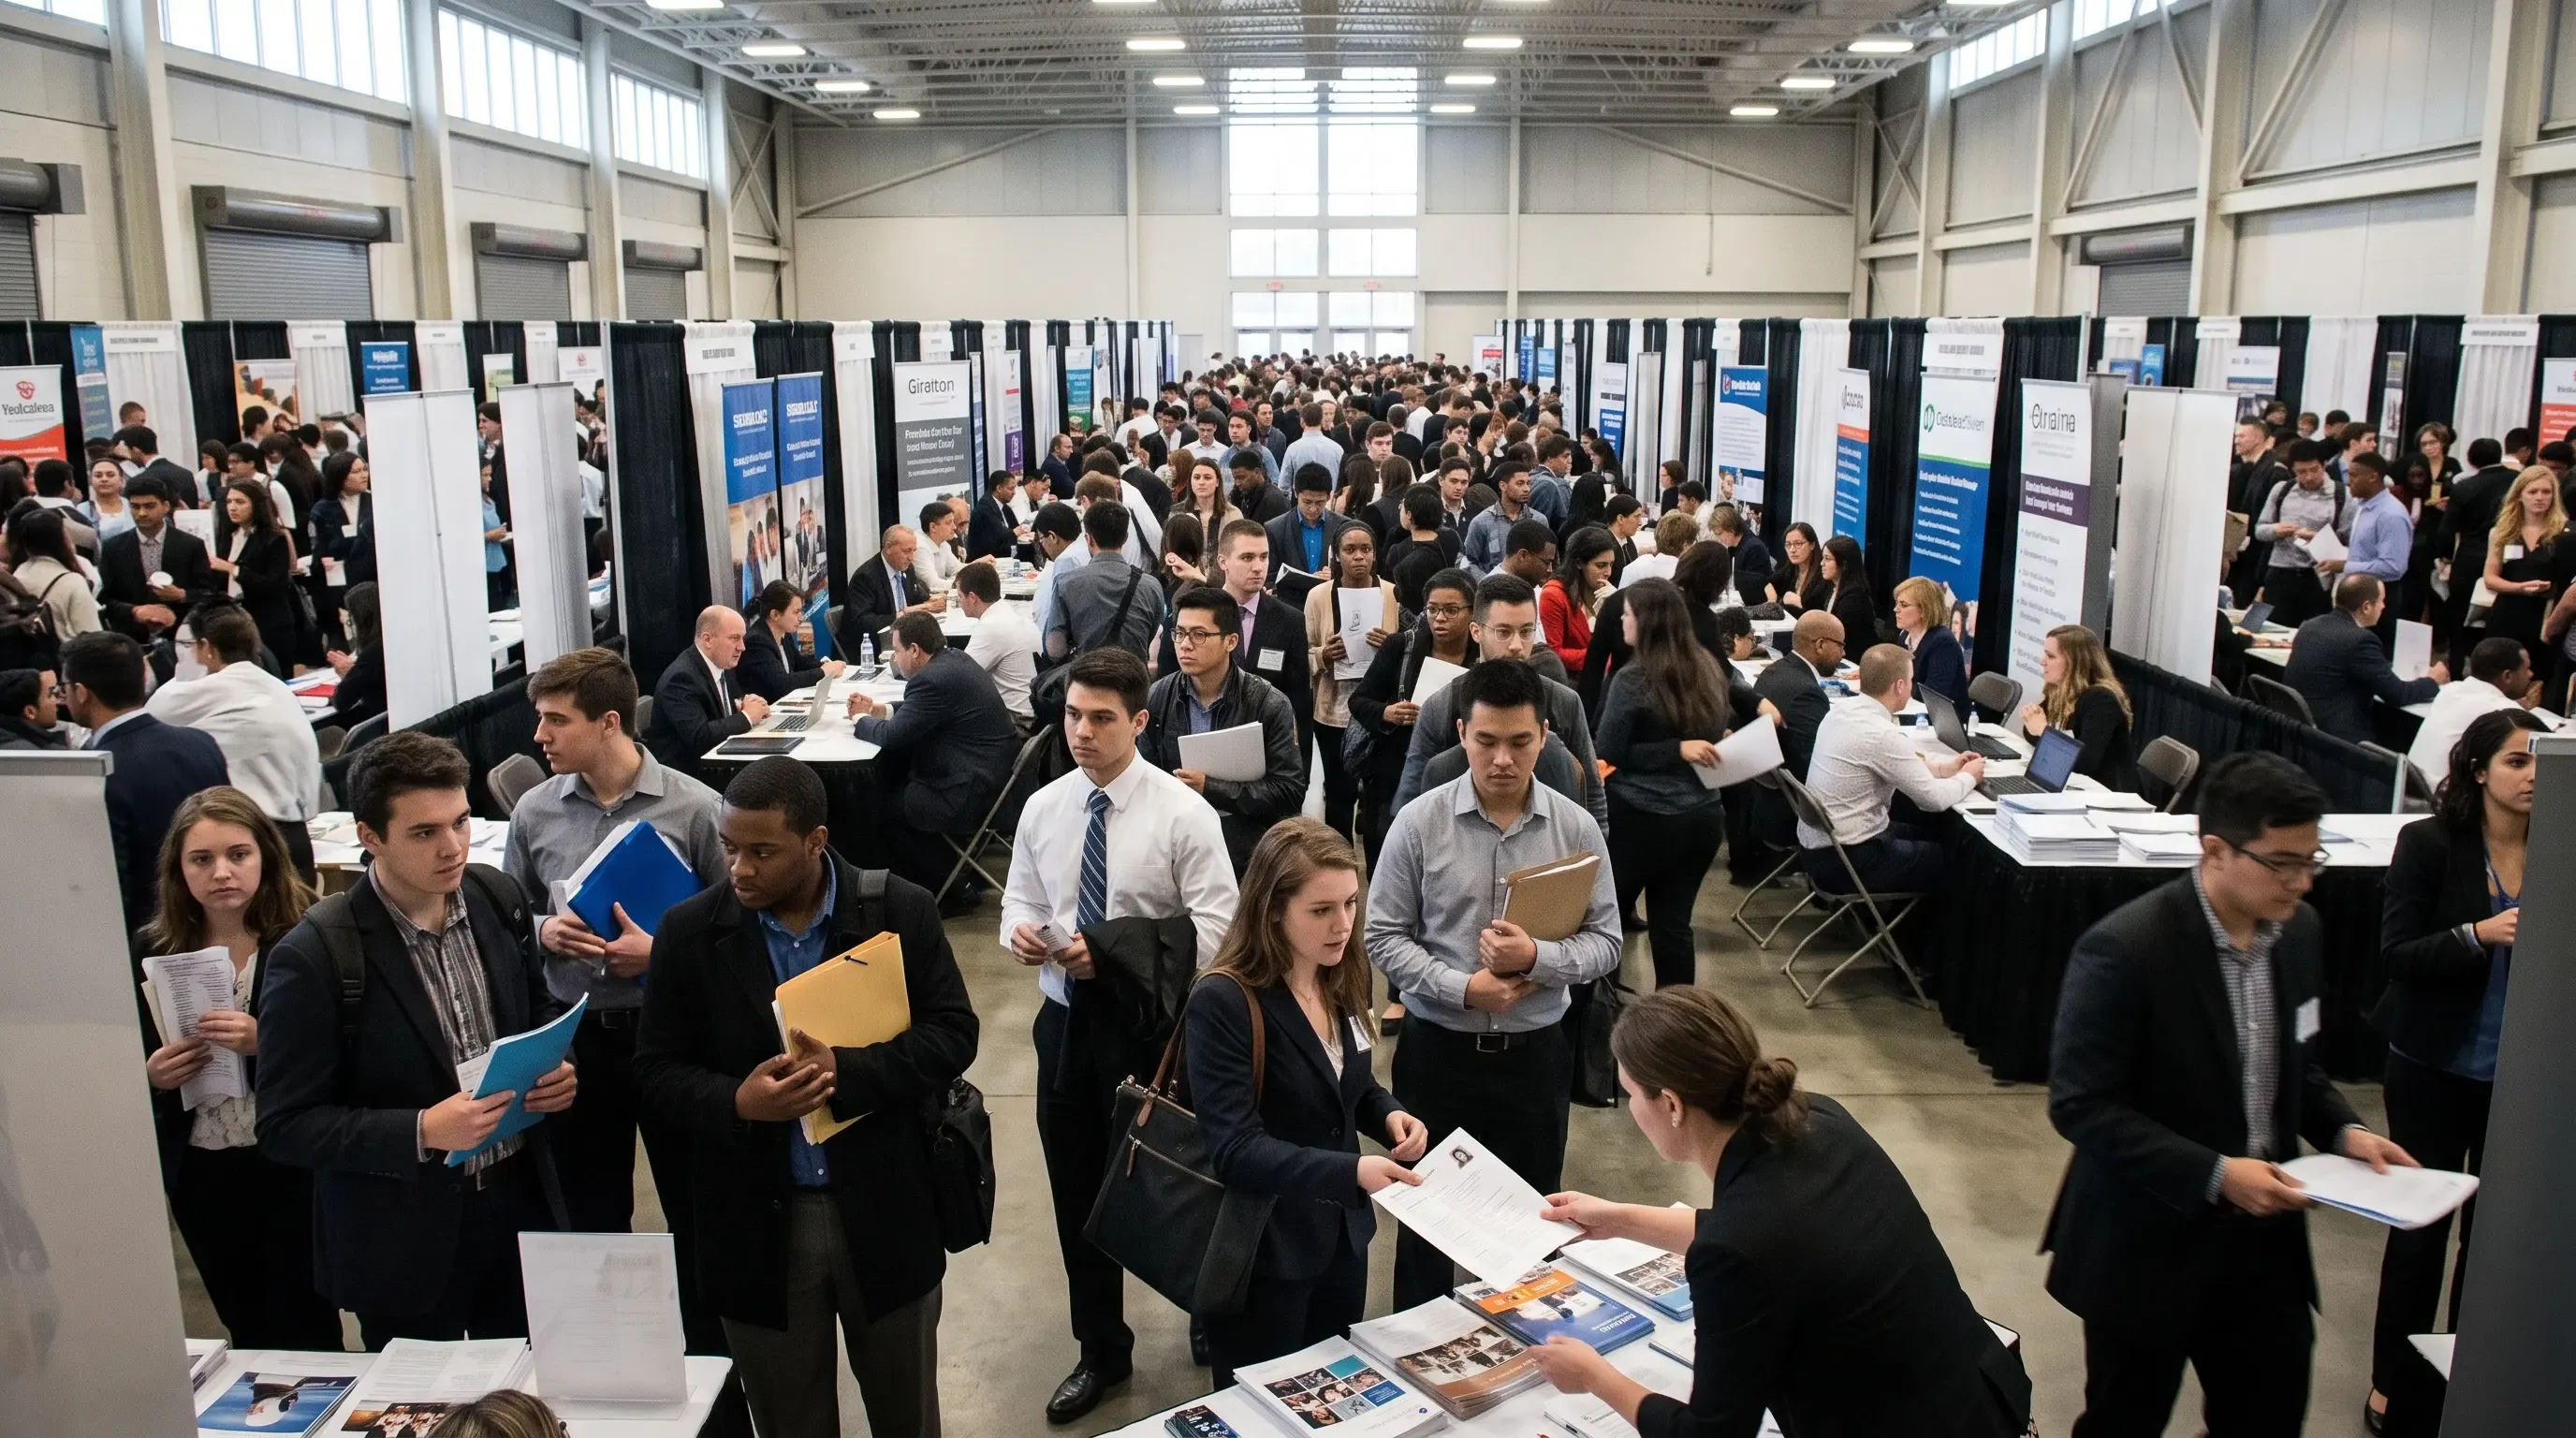
You are standing in a line.
It starts at a folding table at the far end of the hall and runs back past the booths, almost to the door. You are holding a folder with your resume in it. So is everyone else.
You graduated a few months ago. The news says unemployment is low. You have sent more applications than you can count, and you cannot work out why this is so hard.
This is the story of that line: how long it is, why it barely moves, what waits at the front, and how to get there. Every number comes from public data and is sourced.
of young people in the labor force are unemployed. For the workforce as a whole, the rate is 5.0% in both.
Sources: PSA, Labor Force Survey, March 2026. ONS, table A05, October 2026 release.
The line is longer than it looks
Your question: why is the job market so harsh on fresh graduates?
The first thing you learn in the line is that the headline was never about you.
Unemployment was 5.0% in both the Philippines and the UK in early 2026. That sounds healthy. Split it by age, and you find where you are standing.
Two countries, one shape: unemployment is a young person’s problem
Unemployment rate by age group
Philippines, March 2026
United Kingdom, January to March 2026
View data table
| Country | Age group | Unemployment rate | Unemployed (thousands) |
|---|---|---|---|
| Philippines | 15 to 24 | 12.6% | 828 |
| Philippines | 25 to 34 | 6.7% | 1,002 |
| Philippines | 35 to 44 | 2.7% | 323 |
| Philippines | 45 to 54 | 2.8% | 264 |
| Philippines | 55 to 64 | 2.3% | 137 |
| Philippines | 65 and over | 0.9% | 24 |
| Philippines | All aged 15 and over | 5.0% | 2,577 |
| United Kingdom | 16 to 17 | 29.4% | 138 |
| United Kingdom | 18 to 24 | 14.6% | 591 |
| United Kingdom | 25 to 34 | 4.8% | 386 |
| United Kingdom | 35 to 49 | 2.9% | 348 |
| United Kingdom | 50 to 64 | 3.0% | 299 |
| United Kingdom | 65 and over | 2.6% | 47 |
| United Kingdom | All aged 16 and over | 5.0% | 1,808 |
Sources: PSA, Labor Force Survey March 2026, Table 1 (my calculation: unemployed divided by labor force). ONS, table A05, seasonally adjusted. Age bands differ slightly; the UK 16 to 17 group is small and mostly still in school.
Filipinos aged 15 to 24 are 13% of the labor force but 32% of the unemployed. In the UK, an 18 to 24-year-old is three times as likely to be out of work as the average worker. Different economies, same shape.
Source: PSA, Labor Force Survey March 2026 and March 2025, Table 1.
And this year, the line got longer
In a year, UK unemployment rose by 187,000 people. 92,000 of them were 18 to 24-year-olds.
18 to 24-year-olds account for half the rise in UK unemployment
Change in the number of unemployed people, January to March 2025 to January to March 2026, thousands
View data table
| Age group | Jan to Mar 2025 (thousands) | Jan to Mar 2026 (thousands) | Change (thousands) |
|---|---|---|---|
| 16 to 17 | 127 | 138 | +11 |
| 18 to 24 | 499 | 591 | +92 |
| 25 to 34 | 338 | 386 | +47 |
| 35 to 49 | 330 | 348 | +18 |
| 50 to 64 | 278 | 299 | +21 |
| 65 and over | 50 | 47 | −3 |
| All aged 16 and over | 1,621 | 1,808 | +187 |
Source: ONS, table A05, seasonally adjusted. Total change across all ages: +187,000.
Young adults are under a third of the unemployed but half of the rise. Their rate climbed 2.0 points in a year; the overall rate, 0.4.
The gap between young adults and everyone else widened by a fifth in a year
UK unemployment rate, five consecutive quarters, seasonally adjusted
View data table
| Quarter | Aged 18 to 24 | All aged 16 and over | Gap (points) |
|---|---|---|---|
| Jan–Mar 2025 | 12.6% | 4.6% | 8.0 |
| Apr–Jun 2025 | 12.1% | 4.7% | 7.4 |
| Jul–Sep 2025 | 12.8% | 5.0% | 7.8 |
| Oct–Dec 2025 | 14.1% | 5.2% | 8.9 |
| Jan–Mar 2026 | 14.6% | 5.0% | 9.6 |
Source: ONS, table A05. Gap: 8.0 percentage points in January to March 2025, 9.6 points in January to March 2026.
The Philippines moved the same way: from March 2025 to March 2026, unemployment rose from 1.93 million to 2.58 million people, and youth unemployment from 11.0% to 12.6%.
“Aren’t those just students looking for part-time work?”
Mostly not. The ONS separates young people still in full-time education from those who have left it.
Source: ONS, tables A06 and A05, January to March 2026, not seasonally adjusted.
Surely the degree moves you forward?
This is the part that stings. You did the thing you were told would work.
The PSA records the highest grade completed by everyone in work and everyone looking for it, which gives an unemployment rate for each level of schooling.
A Filipino college graduate is more than three times as likely to be unemployed as someone who stopped at elementary school
Unemployment rate by highest grade completed, Philippines, March 2026
View data table
| Highest grade completed | Employed (thousands) | Unemployed (thousands) | Unemployment rate | Share of labor force | Share of unemployed |
|---|---|---|---|---|---|
| No grade completed | 429 | 1 | 0.3% | 0.8% | 0.1% |
| Elementary | 9,189 | 206 | 2.2% | 18.2% | 8.0% |
| Junior high school | 20,009 | 689 | 3.3% | 40.1% | 26.7% |
| Senior high school | 2,213 | 377 | 14.5% | 5.0% | 14.6% |
| Post-secondary | 1,656 | 114 | 6.4% | 3.4% | 4.4% |
| College, did not graduate | 4,581 | 289 | 5.9% | 9.4% | 11.2% |
| College graduate | 10,993 | 901 | 7.6% | 23.0% | 35.0% |
Source: my calculation from PSA, Labor Force Survey March 2026, Tables 5 and 11 (unemployed divided by employed plus unemployed at each level). Each level combines those who completed it and those who started but did not finish, except college, which is shown separately.
That does not make a degree worthless. Graduates are younger on average, and age is the bigger effect: senior high school leavers, most of them under 25, have the highest rate of all at 14.5%. And people with less schooling more often take whatever work exists, which keeps them out of the count but not out of hardship.
It does mean a degree does not move you to the front, and that is not new. In 2015 data, the OECD found people with higher education were 26% of the Philippine labor force and 35% of the unemployed. Today college graduates are 23% and 35%.
Count the jobs at the front
About 11.0 million Filipinos with a college degree are in work. The three top-skill occupation groups, managers, professionals, and technicians, hold about 7.0 million jobs.
Source: my calculation from PSA, Labor Force Survey March 2026, Tables 5 and 6.
Even if every one of those jobs went to a graduate, about four million working graduates would be doing something else. Too many applicants, too few jobs: for graduate work in the Philippines, that is close to literal.
Why the line barely moves
Your question: what factors are driving it?
You shuffle forward one step. Then nothing, for a long time. What is happening at the front?
Seven things hold the line in place. Each is labeled with its source.
Nobody at the front is leaving
The UK employment rate barely moved in a year: 75.0%, against 75.1%. Redundancies, though, rose from 3.1 to 4.2 per 1,000 employees in two years.
Career strategist Jessica Hernandez calls the US version a “low-hire, higher-fire” market: people in jobs stay put, employers trim instead of grow, and whoever is outside waits longest.
Source: ONS, tables A02, RED01 and CLA01, seasonally adjusted.
Graduate jobs come up least often
A seat opens when someone leaves the workforce, someone changes occupation, or a new job is created. The BLS projects all three for every US occupation to 2035.
Jobs that need a degree come up about half as often as jobs that need no credential
Projected openings per year for every 100 existing jobs, by typical education needed for entry, US, 2025 to 2035
View data table
| Typical entry education | Occupations | Jobs, 2025 | Openings per year | Openings per 100 jobs | Leaving the workforce | Changing occupation | Job growth |
|---|---|---|---|---|---|---|---|
| No formal educational credential | 109 | 40.2 million | 5.8 million | 14.5 | 6.3 | 7.7 | +0.2 |
| High school diploma or equivalent | 326 | 60.3 million | 6.2 million | 10.2 | 4.4 | 5.5 | +0.2 |
| Some college, no degree | 7 | 4.2 million | 412,900 | 9.9 | 5.0 | 5.4 | −0.3 |
| Postsecondary nondegree award | 51 | 10.7 million | 1.1 million | 10.3 | 4.1 | 5.4 | +0.6 |
| Associate's degree | 48 | 3.6 million | 330,400 | 9.3 | 3.2 | 5.4 | +0.5 |
| Bachelor's degree | 177 | 42.9 million | 3.1 million | 7.3 | 2.6 | 4.0 | +0.6 |
| Master's degree | 40 | 3.9 million | 301,200 | 7.6 | 2.8 | 3.5 | +1.1 |
| Doctoral or professional degree | 73 | 4.5 million | 219,400 | 4.8 | 2.3 | 1.7 | +0.6 |
Source: my calculation from BLS Employment Projections 2025 to 2035, Tables 1.2 and 1.10, 831 occupations. Labels are total openings per 100 jobs; shrinking groups have no new-job segment.
For every 100 jobs that need a bachelor’s degree, about 7 open each year; for jobs needing no credential, more than 14. Graduate-level occupations hold a quarter of US jobs but produce under a fifth of the openings. They grow faster than average, 5.6% against 3.5%, but people leave them less often.
A third of “graduate” openings want experience you do not have yet
You know this one already. You need the job to get the experience, and the experience to get the job.
Among openings in bachelor’s-level occupations, 35% expect prior experience in a related job, including some of the biggest: general and operations managers, management analysts, financial managers.
Source: my calculation from BLS Employment Projections, occupational data Table 1.2.
The finder in Chapter 3 shows which doors are open to you now.
The first rung is being automated
US employment is projected to grow just 3.5% in ten years. Office and administrative support, the largest occupational group, is projected to lose 752,000 jobs.
Care and computing grow. Office support and sales shrink.
Projected change in US employment by major occupational group, 2025 to 2035
View data table
| Occupational group | Jobs, 2025 | Projected change, 2025 to 2035 |
|---|---|---|
| Healthcare support | 8.4 million | +13.3% |
| Healthcare practitioners and technical | 10.2 million | +8.0% |
| Life, physical, and social science | 1.6 million | +7.5% |
| Community and social service | 3.3 million | +7.4% |
| Computer and mathematical | 5.5 million | +7.3% |
| Architecture and engineering | 2.7 million | +6.8% |
| Management | 13.7 million | +6.2% |
| Business and financial operations | 11.4 million | +5.5% |
| Installation, maintenance, and repair | 6.5 million | +5.4% |
| Construction and extraction | 7.5 million | +5.1% |
| Food preparation and serving | 13.8 million | +4.4% |
| Personal care and service | 4.5 million | +4.4% |
| Transportation and material moving | 14.1 million | +4.3% |
| Legal | 1.4 million | +2.9% |
| Building and grounds cleaning and maintenance | 5.7 million | +2.6% |
| Arts, design, entertainment, sports, and media | 3.0 million | +1.5% |
| Educational instruction and library | 9.9 million | +1.4% |
| Protective service | 3.9 million | +1.1% |
| Production | 8.8 million | −0.4% |
| Sales and related | 14.5 million | −1.4% |
| Farming, fishing, and forestry | 1.0 million | −1.5% |
| Office and administrative support | 18.8 million | −4.0% |
Source: BLS Employment Projections, Table 1.1. All occupations: +3.5%.
Many classic first office jobs are on the shrinking list: word processors and typists (−34.4%), data entry keyers (−25.5%), payroll and timekeeping clerks (−15.9%), bank tellers (−13.2%), general office clerks (−6.0%) and customer service representatives (−5.3%).
The BLS names artificial intelligence in its reasoning for 42 occupations; in 38 it is a reason for losing ground. In its own words:
“Share decreases as advances in speech and language processing and in artificial intelligence (AI) allow computers to handle customer service interactions with greater frequency.”Customer service representatives, projected −5.3% by 2035. BLS, Table 1.12. “Share” means the occupation’s share of jobs within its industries.
“Share decreases as organizations increasingly manage, store, and analyze large quantities of data, requiring traditional data entry methods to be replaced by automated processes through use of expanded technologies, including artificial intelligence (AI), machine learning (ML), mobile data capture, and optical character recognition (OCR).”Data entry keyers, projected −25.5% by 2035. BLS, Table 1.12. “Share” means the occupation’s share of jobs within its industries.
“Share decreases as computer programming tasks are more commonly performed by other computer occupations, such as software developers. Computer programming work also continues to be automated, including with artificial intelligence (AI), allowing computer programmers to become more efficient.”Computer programmers, projected −7.3% by 2035. BLS, Table 1.12. “Share” means the occupation’s share of jobs within its industries.
“Share increases as demand for continuous training increases due to accelerating technological advancements such as artificial intelligence (AI) in the labor market.”Training and development specialists, projected +10.8% by 2035. BLS, Table 1.12. “Share” means the occupation’s share of jobs within its industries.
Source: BLS Employment Projections, occupational data Tables 1.2, 1.5, 1.11 and 1.12.
A degree is no shield: computer programmers (−7.3%), journalists (−5.9%) and graphic designers (−1.7%) all shrink, while data scientists grow 34.6% and information security analysts 21.0%. Which line you join matters more than it used to.
While you were studying, the list of skills changed
Employers were short of skills before AI. In a Philippine labor department survey reported by the OECD, 36% of firms said a lack of the right skills was the main reason vacancies were hard to fill. A World Bank survey found the hardest to find were not technical: managerial, leadership, interpersonal and communication skills.
Source: all three as reported in OECD (2017), Employment and Skills Strategies in the Philippines, chapter 1. These are the oldest figures on this page.
Then generative AI moved the goalposts. Coursera tracks what six million people learning through their employers, governments and universities enroll in: not what employers demand, but what people already in work think they need next.
Source: Coursera (2026), Job Skills Report 2026.
Employers already short of people who communicate, lead and decide now also want people who can work with AI, and the workers ahead of you are learning both.
The wait is long, or it is hidden
When hiring slows, people stay unemployed longer. In the UK, the fastest-growing group of young jobseekers has been looking for six months to a year.
The number of young adults searching for 6 to 12 months grew 47% in a year
Unemployed 18 to 24-year-olds by how long they have been looking, UK, thousands
View data table
| Time unemployed | Jan to Mar 2025 (thousands) | Jan to Mar 2026 (thousands) | Change |
|---|---|---|---|
| Up to 6 months | 323 | 352 | +9.0% |
| 6 to 12 months | 71 | 105 | +47.3% |
| Over 12 months | 105 | 135 | +28.6% |
| All unemployed aged 18 to 24 | 499 | 591 | +18.5% |
Source: ONS, table UNEM01, seasonally adjusted.
About 239,000 young adults in the UK, 40% of those unemployed, have been looking for more than six months.
In the Philippines the wait looks short on paper: 4.1 weeks on average in July 2025, the latest figure. Few can afford to stay unemployed for long, so the wait moves inside work: short-term jobs, too few hours, and looking from there.
Sources: PSA, Labor Force Survey March 2026 and March 2025, Tables 1 and 9. ONS, table EMP01, January to March 2026. These figures cover all ages.
The line itself has become noisy
The last reason is not in any government table. It comes from hiring platforms and surveys gathered by Hernandez in September 2026. Treat it as indicative: I could not check the original methods.
Source: figures as cited in Hernandez, J. (3 September 2026), Why Is Finding a Job So Hard in 2026?
Some booths are empty, most of the crowd queues at one, and the people behind the table trust your folder less than they used to. A new graduate, with the thinnest track record, feels that most.
What is waiting at the front
Your question: which skills and tools make me relevant?
Eventually you reach the table. Someone looks up from a stack of folders and asks what you can do.
The BLS scores every occupation on 17 skills and publishes its top three. Among occupations that need a bachelor’s degree, a few turn up again and again.
Adaptability is a top-three skill in four out of five graduate-level occupations
Share of the 177 US occupations typically needing a bachelor’s degree in which each skill ranks in the top three
View data table
| Skill | Occupations where it ranks top three | Share |
|---|---|---|
| Adaptability | 141 | 79.7% |
| Writing and reading | 94 | 53.1% |
| Problem solving and decision making | 58 | 32.8% |
| Computers and information technology | 45 | 25.4% |
| Critical and analytical thinking | 43 | 24.3% |
| Detail oriented | 37 | 20.9% |
| Interpersonal | 34 | 19.2% |
| Speaking and listening | 26 | 14.7% |
| Leadership | 21 | 11.9% |
| Mathematics | 12 | 6.8% |
| Creativity and innovation | 11 | 6.2% |
| Customer service | 7 | 4.0% |
| Science | 2 | 1.1% |
Source: my calculation from BLS Employment Projections, skills data Table 6.2. Skills that rank in no occupation’s top three are omitted.
The most common are not tools: learning quickly, reading and writing well, and making decisions. They match what Philippine employers find hardest to hire for, and what AI job ads list first.
Tools still matter, and they change fast. These skills climbed Coursera’s enrollment rankings fastest over two years.
What people already in work are racing to learn
Five fastest-growing skills by career area, Coursera enterprise learners, October 2023 to September 2025
Data
- Multimodal prompts
- Critical thinking
- AI personalization
- Prompt engineering
- Excel formulas
IT
- JSON
- Generative model architectures
- Machine learning methods
- Natural language processing
- Artificial neural networks
Software and product
- Unsupervised learning
- Supervised learning
- Artificial neural networks
- Generative model architectures
- Web applications
Generative AI, any role
- Content creation
- AI personalization
- Generative AI agents
- Image analysis
- Information privacy
Source: Coursera (2026), Job Skills Report 2026. Ranked by improvement in enrollment rank among six million enterprise learners. This measures what learners choose to study, not what employers require. SQL also appears in the top ten for both IT and software.
So the answer at the table has three layers: a foundation that does not date, a current tool or two, and the judgment to check what the tool gives you.
Now ask it for your own job
Type a job title to see the official outlook for the closest occupation, whether it expects experience, why the BLS expects it to grow or shrink, the skills it demands, and what turns up beside it in real job ads.
Outlook, pay, experience, turnover, reasoning and skill scores: BLS Employment Projections 2025 to 2035 (US figures, pay in US dollars). Job-ad skills: the skill2vec dataset of job descriptions. Fastest-growing skills: Coursera Job Skills Report 2026. See Sources and credits for how each part works and where it is weak.
How to get to the front
Your question: what strategies actually help when applying?
You cannot make the line shorter. You can choose which line you stand in, what you carry, and whether anyone at the front is expecting you.
Start with how people actually find work. The PSA asks every unemployed Filipino who is looking how they look.
Four in ten Filipino job-seekers look through relatives and friends. Fewer than one in ten use advertisements.
Main job search method of unemployed persons looking for work, Philippines, July 2025
View data table
| Job search method | Persons (thousands) | Share |
|---|---|---|
| Approached relatives or friends | 599 | 40.9% |
| Approached the employer directly | 356 | 24.3% |
| Registered with a private employment agency | 197 | 13.4% |
| Registered with a public employment agency | 148 | 10.1% |
| Placed or answered advertisements | 136 | 9.3% |
| Other methods | 30 | 2.0% |
Source: PSA, Labor Force Survey July 2025, Table 19, the latest with this question. Covers the 1.46 million unemployed people actively looking for work.
People first, postings last: two thirds go through someone they know or straight to the employer. LinkedIn reports the same from the other side of the world: candidates are three times more likely to be hired where they already know an employee. Each strategy below answers a reason from Chapter 2.
Choose your line
Before you commit months to one job title, look it up in the finder: projected growth, openings per year, and whether it expects experience. A shrinking occupation that wants five years of experience is the wrong line, however good you are.
Why: only 1 in 9 openings is a true graduate entry point, and 33 of 177 bachelor’s-level occupations are shrinking. BLS
Lead with the skills that travel
Give each of the three most common graduate skills one concrete story:
- Adaptability: something you learned fast, under pressure.
- Writing and reading: something you wrote that someone used.
- Problem solving: a decision you made with incomplete information.
Why: they rank in the top three for 80%, 53% and 33% of bachelor’s-level occupations, and employers report communication and interpersonal skills as the hardest to find. BLS, OECD
Add the AI layer, and the judgment to check it
Learn one generative AI tool properly for your field. Then practice the harder half: checking its output and explaining what is wrong. A short, recognized certificate makes the skill visible.
Why: generative AI enrollments grew 234% in a year and critical thinking 185% alongside it. Coursera also reports that 96% of employers say micro-credentials strengthen an application, though that figure comes from its own research. Industry-reported (Coursera)
Show proof, not polish
Everyone has a polished resume now. Build one or two pieces of visible work in your field, write applications in your own voice, and link to the work.
Why: employers report they can no longer tell candidates apart on paper and are turning to assessments, work samples and trials. Industry-reported
Check the booth is staffed
Before spending an evening on an application, check for signs of a ghost job:
- Posted 90 or more days ago
- Reposted again and again
- No company name or specific details
- A generic, catch-all description
- An unusually wide salary range
Why: roughly one posting in five has no hire behind it. Industry-reported (Greenhouse)
Do not queue at the busiest booth
Keep the big job boards, but do not rely on them alone: use company career pages, sector boards, your university careers service, public employment offices and direct approaches.
Why: LinkedIn reportedly receives around 158 times the applications of any other site, while a quarter of Filipino job-seekers go straight to the employer. Industry-reported (Huntr), PSA
Get a name inside before you apply
For any role you really want, find one person at the company first: an alum, a classmate, a relative, a friend of a friend. Ask about the work, not for a job. Then apply.
Why: 41% of Filipino job-seekers already search through relatives and friends, LinkedIn reports a threefold hiring advantage for candidates who know an employee, and one in three companies has turned to referrals to cut applicant volume. PSA, industry-reported (LinkedIn, Erin)
Plan for a longer search
Budget money and energy for six months or more, not six weeks. Keep one skill-building project going so the gap on your resume has an answer. A temporary or part-time role while you search is common, not a failure.
Why: 40% of unemployed young adults in the UK have been looking for over six months, and nearly one in four employed Filipinos is in short-term, seasonal or day-to-day work. ONS, PSA
The line is real, and it is longer than it was. You did not make it, and standing in it harder will not move it.
What you can change is which line you join, what is in your folder, and whether someone at the front already knows your name. The data cannot make the wait short, but it can stop you spending it in the wrong place.
Where every number comes from
Research, analysis, writing and visualization by Chim Zoe Catalan. The data belongs to the organizations and authors below. I am grateful to all of them for publishing it.
Official statistics and datasets
- Philippine Statistics Authority (PSA). Labor Force Survey, March 2026 and March 2025, final estimates, full statistical tables 1 to 11. Used here: Tables 1, 5, 6, 9 and 11. psa.gov.ph. Labor Force Survey, July 2025, final estimates, statistical tables 1 to 20. Used here: Tables 19 and 20, job search methods and weeks spent looking, which the March tables do not include. psa.gov.ph
- Office for National Statistics (ONS), United Kingdom. Labour market datasets, October 2026 release: A02, A05, EMP01, RED01 and UNEM01 (seasonally adjusted), A06 (not seasonally adjusted) and the claimant count, CLA01. Labour Force Survey estimates for January to March 2026, compared with the same quarter of 2025 and 2024. ons.gov.uk
- US Bureau of Labor Statistics (BLS), Employment Projections program. Skills data, 2025 to 2035: Tables 6.1 to 6.5 and the detailed EP Skills Data file. bls.gov/emp/data/skills-data.htm. Occupational data, 2025 to 2035: Tables 1.1, 1.2, 1.5, 1.10, 1.11 and 1.12. bls.gov/emp/data/occupational-data.htm
- O*NET 30.0 Database, US Department of Labor, Employment and Training Administration. The underlying skill elements in the BLS skills data.
- Van-Duyet, L., Quan, V. M., and An, D. Q. (2017). Skill2vec: Machine Learning Approach for Determining the Relevant Skills from Job Description. arXiv:1707.09751. arxiv.org/abs/1707.09751. Dataset: skill2vec-dataset, 50K job descriptions file, © 2019 Van-Duyet Le, MIT License.
Reports and articles
- OECD. (2017). Employment and Skills Strategies in the Philippines. OECD Reviews on Local Job Creation. OECD Publishing, Paris. ISBN 978-92-64-27342-9. oecd.org
- Coursera. (2026). Job Skills Report 2026: Insights on the fastest-growing job skills for business, government, and education leaders. coursera.org/skills-reports/job-skills
- Hernandez, J. (3 September 2026). Why Is Finding a Job So Hard in 2026? (4 Real Reasons). LinkedIn. linkedin.com
Sources cited inside those reports
I did not consult these originals. I am reporting them as the reports above describe them, and each is labeled that way where it appears.
- Through the OECD review: Philippine Statistics Authority, Labour Force Survey 2015. Department of Labor and Employment establishment survey, 2012, as reported by the PSA (2016). World Bank Enterprise Survey, Philippines, 2015. Asian Development Bank staff estimates from the Labour Force Survey, 2013.
- Through the Coursera report: Lightcast (2025), Beyond the Buzz: Developing the AI Skills Employers Actually Need. Coursera (2025), Micro-Credentials Impact Report 2025.
- Through the Hernandez article: Greenhouse hiring platform data. Huntr, Q1 and Q2 2026 job search reports. LinkedIn. Erin, employee referral software. The 77% and 54% resume figures are cited there without a named source.
How I worked
- Philippines. From the March 2026 and March 2025 tables: unemployment rates by age (unemployed divided by labor force) and by highest grade completed (unemployed divided by employed plus unemployed), and employed college graduates against jobs in the three top-skill occupation groups.
- United Kingdom. Unemployment by age and by time spent looking, education status, temporary and part-time work, redundancies and the claimant count, January to March 2026 against the same quarter one and two years earlier.
- United States. The BLS skills and occupational tables joined on occupation code for 831 occupations and grouped by typical entry education: openings per 100 jobs and their causes, prior experience, and how often each skill ranks in the top three. I also counted the occupations whose all-industry explanation mentions artificial intelligence.
- Job-ad skills. For 74 occupations and 22 everyday job titles I chose a few defining terms by hand (for a graphic designer: “graphic design”, “graphic designer”), found the skill2vec job descriptions listing any of them, and ranked the other skills by how often they appear. A skill shows only if it is at least twice as common there as in the file overall; job titles, degrees and generic words are removed.
- Job-title search. It matches the 831 BLS occupation titles plus 95 everyday titles I mapped by hand to the closest one, such as “data analyst”, which has no BLS occupation of its own.
Limits you should know about
- Different countries, different years. Philippines: March 2026 against March 2025 (July 2025 for job search). UK: January to March 2026 against 2025, as three-month averages. US: projections to 2035. OECD: the Philippines, 2012 to 2015. The patterns agree, but one does not prove the other.
- Nobody publishes “fresh graduates” directly. I use young adults (15 to 24 in the Philippines, 18 to 24 in the UK) and, in the Philippines, college graduates of all ages. The PSA tables cannot separate age from education.
- Survey estimates move around. Both labor force surveys are samples, so I compare year on year. The ONS says its estimates from January to March 2025 onwards include its 2024 survey improvements, so the two years compare fairly, but advises against reading much into short-term changes. Philippine youth unemployment swings with the school year, hence March against March. The PSA job-search tables (July 2025) cover only the 1.46 million unemployed people actively looking. No source here counts vacancies.
- Projections are not forecasts of your job search. BLS figures describe expected US change over ten years. “Typical education” and “work experience” describe a typical path, not a rule.
- The job-ad lists are the weakest part. The skill2vec file holds about 46,000 job descriptions collected before 2018, mostly from South Asian job boards and tilted toward IT, finance, sales and marketing. It predates generative AI, shows which skills appear together rather than which are required, and is too thin for health, teaching, law or science roles, which show official skills only.
- Coursera measures learners, not employers. Its rankings show what people enroll in. Coursera sells courses, so treat its findings on the value of courses and certificates with that in mind.
- Industry figures are second-hand. The ghost-job, application-volume and resume-trust figures come from one practitioner’s article citing company data, mostly from the US. I could not review their methods.
Data ownership and use. I do not own any of the data or source material used on this page. All statistics, tables, reports and quotations remain the property of the organizations and authors credited above. They are used here for non-commercial research and educational purposes only, with attribution.
ONS material contains public sector information licensed under the Open Government Licence v3.0. BLS material is in the public domain. The skill2vec dataset is used under the MIT License. Material from the PSA, the OECD, Coursera and Jessica Hernandez remains © its respective publisher or author.
The analysis, calculations, charts and wording are my own, and so are any errors. Nothing here is endorsed by the organizations cited. It is general information, not career, financial or legal advice. If you hold rights to anything shown here and would like it corrected or removed, please contact me through this site.
Source data
Download the data
None of these files are mine. Each belongs to the organization or authors named with it and is offered here unchanged, so you can check the numbers or run your own analysis.
-
Labor Force Survey, March 2026 and March 2025
Philippine Statistics Authority (PSA)
Final estimates, full statistical tables 1 to 11 for each month, as 22 Excel files. This page uses tables 1, 5, 6, 9 and 11.
© Philippine Statistics Authority. Shared unchanged, for non-commercial research and educational use, with attribution.
-
Labor Force Survey, July 2025
Philippine Statistics Authority (PSA)
Final estimates, statistical tables 1 to 20, as 20 Excel files. This page uses tables 19 and 20, job search methods and weeks spent looking, which the March tables do not include.
© Philippine Statistics Authority. Shared unchanged, for non-commercial research and educational use, with attribution.
-
UK labour market tables, October 2026
Office for National Statistics (ONS), United Kingdom
Labour Force Survey datasets A02, A05, A06, EMP01, RED01 and UNEM01 and the claimant count (CLA01), released October 2026, with every quarter back to 1992. This page uses January to March 2026 and the same quarter of 2025 and 2024.
Contains public sector information licensed under the Open Government Licence v3.0.
-
Employment Projections 2025 to 2035: occupational data
US Bureau of Labor Statistics (BLS)
Tables 1.1 to 1.12: employment, projected change, openings, entry education, experience and the reasons behind each projection.
Public domain. A work of the US federal government.
-
Employment Projections 2025 to 2035: skills data
US Bureau of Labor Statistics (BLS)
Tables 6.1 to 6.5: importance scores for 17 skill categories and the top three skills of every occupation.
Public domain. A work of the US federal government.
-
Employment Projections 2025 to 2035: detailed skills data
US Bureau of Labor Statistics (BLS)
The detailed EP Skills Data file: the specific abilities behind each skill category, drawn from the O*NET 30.0 Database.
Public domain. A work of the US federal government.
-
skill2vec dataset: 50K job descriptions
Van-Duyet Le, Vo Minh Quan and Dang Quang An
The job-description file behind the job-ad skill lists, with the authors' README and licence.
© 2019 Van-Duyet Le. MIT License, included in the download.